
High-Performance Dashboarding
Marrying Back-end Brawn with Front-end Beauty
IRI has also partnered with a leader in dashboarding technology to connect our fast data staging performance with state-of-the-art data visualizations. iDashboards turns pre-processed data into dynamic, graphical business intelligence that you can see and use.
Use iDashboards with the SortCL program in CoSort or Voracity to:
- prepare and translate raw data into graphical business intelligence
- help unify and direct diverse departments to business goals and action
- import and export Excel spreadsheet data and display preferences
- integrate SortCL and other application outputs with DB sources
SortCL can filter, sort, join, aggregate, scrub, protect, and reformat your data into the CSV or XML export file your dashboard needs. This frees your BI application to do what it does best: present.
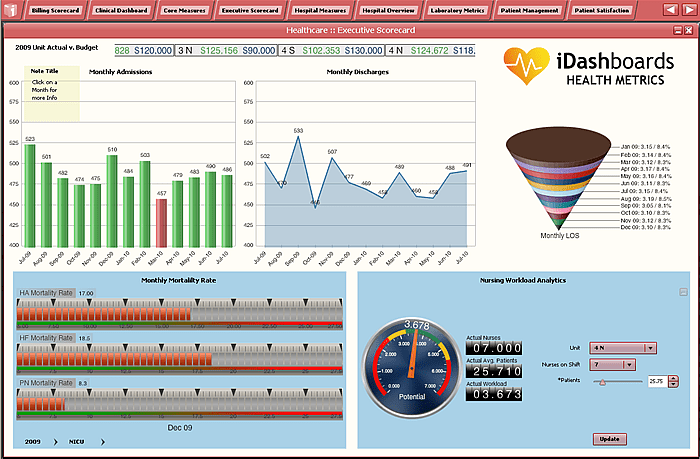
The iDashboard application uses patented "Visual Intelligence" technology to customize views with a library of chart types, including: tables, 3D views, maps, tickers, speedometers, and ad hoc data displays.
As a high-performance data transformation engine for the integration and staging of big sources of structured data, SortCL prepares data for import into your dashboard. The dashboard can also further filter SortCL's output data, and integrate it with other sources for additional insights.