
Eclipse BIRT Integration
Feeding the Business Intelligence Reporting Tool
Business Intelligence Reporting Tool (BIRT) is the free, open source reporting system built on Eclipse™. Millions of developers use BIRT worldwide.
BIRT is also the foundation of the OpenText BIRT iHub, a commercial extension for advanced dashboards, scorecards, predictive analytics, and other sophisticated data visualizations and rich internet applications.
IRI collaborated with OpenText to combine IRI CoSort data preparation with free or commercial BIRT visualizations in Eclipse. BIRT works directly with the CoSort SortCL program in the same Eclipse GUI to produce powerful reports from immediate fit-for-purpose data sets.
Specifically, SortCL prepares (franchises) data in big file and database sources for BIRT users by filtering, cleansing, sorting, joining, aggregating, masking, and formatting their data, then passing it into BIRT, either:
- statically, by producing flat (CSV) file subsets that BIRT can rapidly ingest and use as a data source
OR
- dynamically, via in-memory transfer of CoSort results into industry-driven BIRT templates (through Open Data Access in Eclipse)
This dynamic integration provides for seamless metadata exchange and data flows for end-to-end data preparation and presentation -- from SortCL to BIRT. For more information, see this announcement and this section.
Now you can easily and quickly prepare data for BIRT reports without leaving Eclipse, or resorting to a database, Hadoop , third-party ETL or expensive data blending engine. The SortCL program inside the IRI CoSort data transformation product or IRI Voracity data management platform feeds data and metadata directly into BIRT at reporting time so you can focus on data presentation, not preparation.
Data preparation (transformation) in the IRI CoSort SortCL program can occur before or during BIRT reporting operations.
Before BIRT, SortCL can hand off data to a CSV file or a DB table that BIRT can use
During BIRT, the SortCL output field and metadata pass to BIRT via ODA in real-time
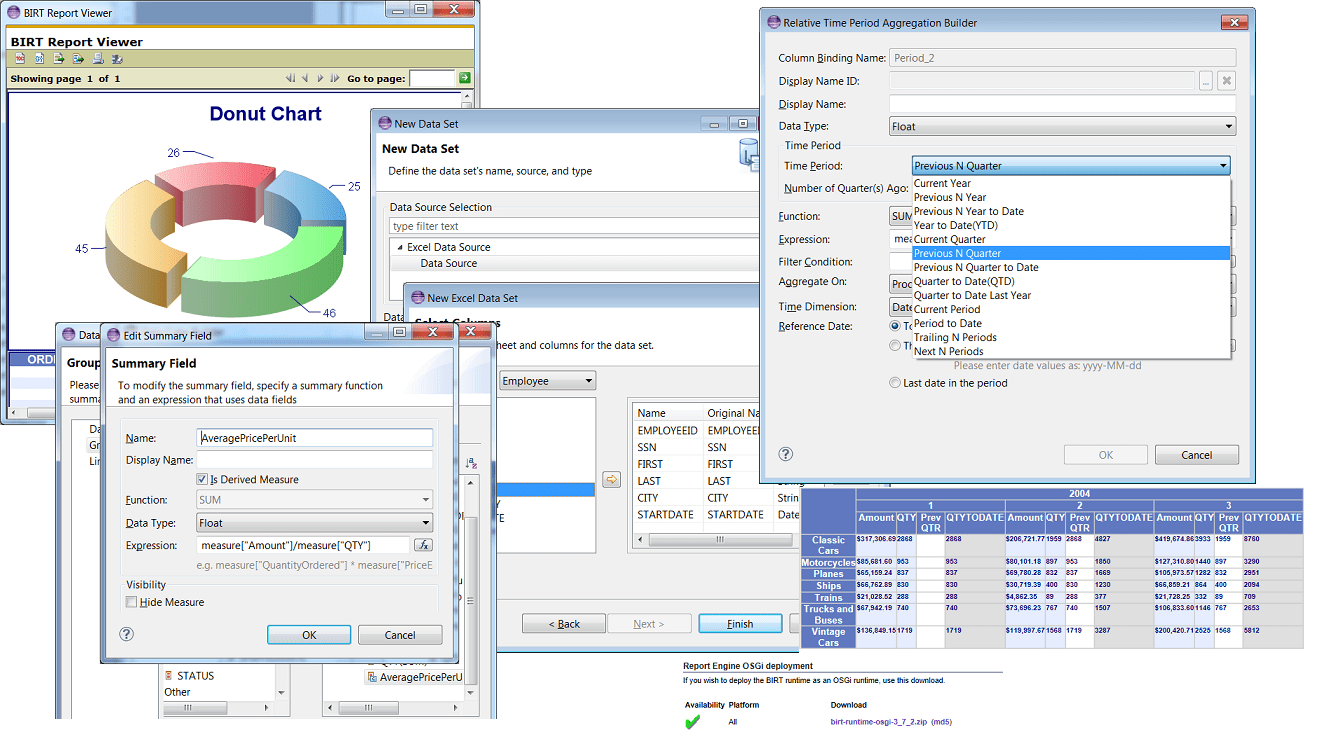
Building a BIRT report that uses SortCL-prepared data in real-time is as simple as it is efficient.
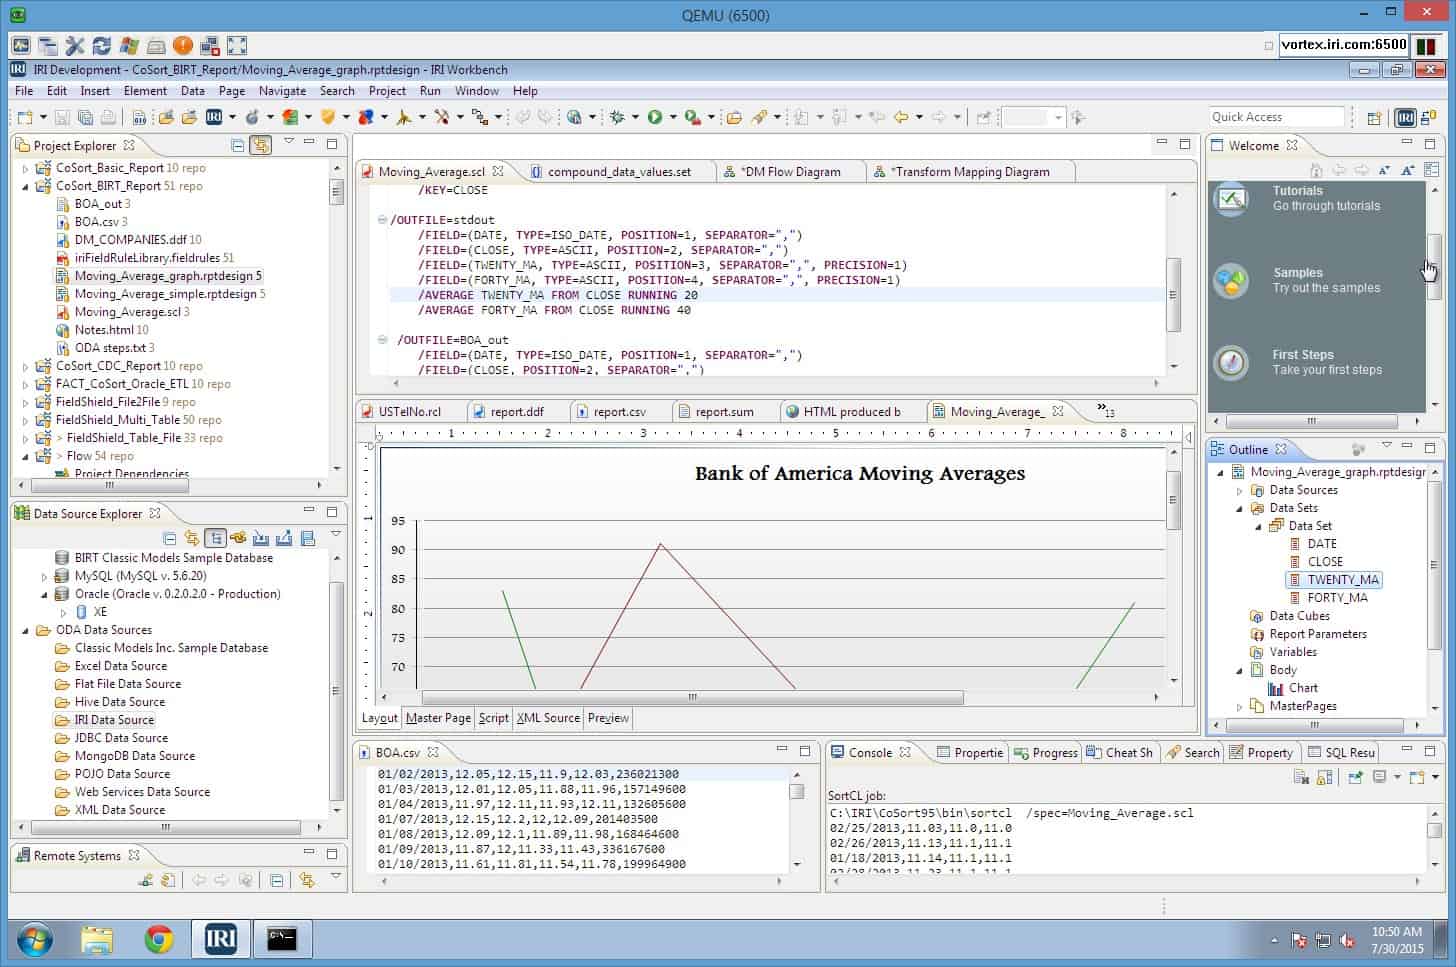
1. preparation job in the IRI Workbench where BIRT is running. In the SortCL script, your first target definition section must specify /OUTFILE=stdout so the BIRT report will use the standard output of SortCL as its "IRI Data Source.
2. Ensure that all /OUTFILE fields included in your report also specify supporting fields. For example, include the /SUMMARY fields so their formatted fields get populated with aggregate values.
3. Tell your BIRT report template to use the output fields named in the stdout section of the SortCL script, so those values feed the display. BIRT can also perform further calculations on the SortCL results, if necessary.
Note that you can also independently target other file, table, and/or procedural targets while generating stdout for BIRT.
Open Data Access (ODA) allows BIRT and IRI CoSort's SortCL data transformation (and masking) program to communicate at reporting time.
Through the ODA connection, BIRT reads and runs the SortCL script of your choice so you can create reports and charts of endless design possibilities. This diagram shows the basic flow of data from the original file through SortCL and to BIRT.
Since running a report runs the SortCL script, any changes made to the script are effortlessly added to the report. Simply make your change, save it, and refresh or rerun your report. There is no need to recreate the connection or change anything else.
BIRT reports can now make direct use of the data that all IRI software (using SortCL as its foundation*) rapidly prepares. BIRT templates or report designs can be simple or complex.
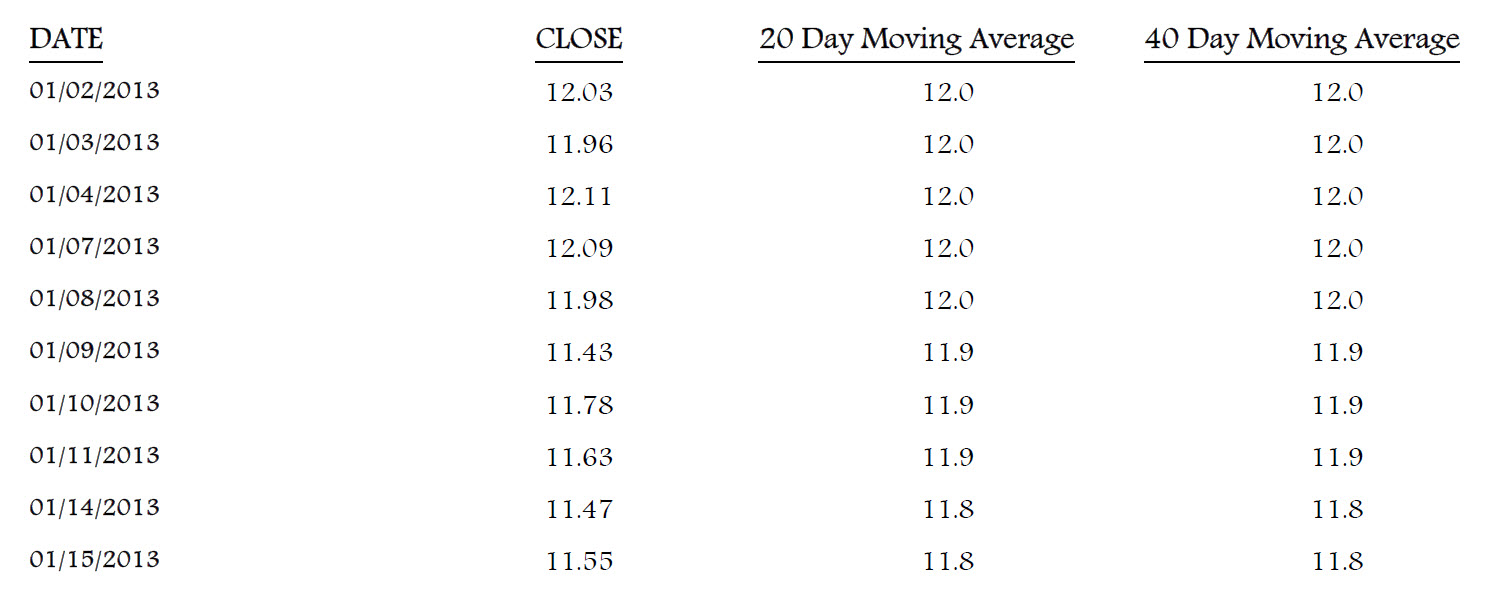
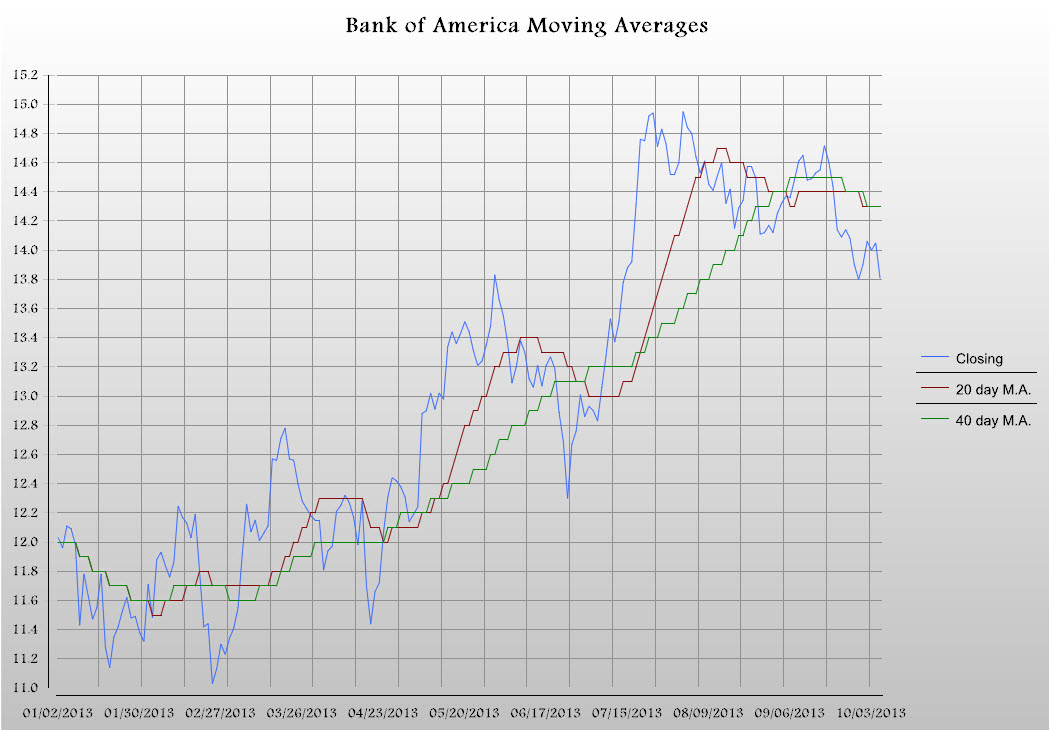
The sample reports below both used the same input data and a Voracity or CoSort SortCL job script. The source data was the closing prices for Bank of America stock in September 2013. Windowed aggregate lag functions in SortCL were used to create 20-day and 40-day moving average intersections. Moving standard deviations are also supported.
The BIRT report below shows a basic columnar layout with headers to organize the data:
This next BIRT report graphs the same results in a way users can more readily understand:
Linear Regression with BIRT/Statistical Libraries
With IRI Voracity and open sources Boost libraries, you can simultaneously:
process big data from any number of sources
predict trends with linear regression analysis
include all the reporting data and labels you need
and design it all in the same pane of glass, built on Eclipse.
Learn how to Boost your analytics with Voracity and BIRT
Commercial BIRT Extensions
With OpenText Analytics Designer, you can design and create dynamic reports with embedded analytics, visualizations, personalized dashboards, and more.
The enterprise-grade software allows users to extract more information from their data. You can leverage the extension to create hundreds of HTML5-powered charts, maps, and perform impact analysis.